Real-time dashboards are a great way to learn how a web framework handles state, background tasks, and UI updates. This tutorial builds one: live prices, a positions table with P&L (profit and loss), an updating chart, and a threshold alert. It's a real application in pure Python with Reflex.
It's for developers and quants who need real-time updates, custom logic, and full control over the app, not another BI tool or no-code builder. It's also for Python developers who'd rather not hand-write a React frontend just to visualize data.
TL;DR
- This build ends with a real-time trading dashboard, running in pure Python with Reflex, no JavaScript.
- A
DashboardStateclass models your watchlist, live prices, positions, and P&L, the key metrics this dashboard tracks and lets you analyze. - Prices stream in through a background task that changes state on an interval, and the UI updates automatically.
- The chart updates live, with a threshold alert built from plain Python conditionals.
- Every line of code is yours, with full access to the repo; deploy it with one command or self-host it.
Prerequisites
What you need before you create a dashboard like this one:
- Python 3.10 or higher: check yours with
python3 --version. - uv: the installer Reflex recommends by default. Using pip, venv, conda, or poetry instead works too.
- Basic Python familiarity: classes, and type annotations.
- No API key required: this tutorial runs on a simulated price feed by default. Switch to Finnhub later for real data, which gives a free real-time tier with just an email signup.
Step 1. Set Up the Project
This step gets a blank Reflex app running in your browser, before you write any dashboard code.
Install uv
If you don't already have uv installed, then install it with:
On Windows, use:
Whichever one you ran, uv just got added to your PATH, but your current terminal doesn't recognize it yet. Restart it, or run source ~/.bashrc on Mac or Linux (source ~/.zshrc for zsh) to skip the restart.
If you're on macOS with Apple Silicon, then install Rosetta 2 too:
Scaffold the app with Reflex
Create a project folder, and add Reflex:
uv init sets up a pyproject.toml. uv add reflex installs Reflex into a managed virtual environment, so you never activate one by hand.
uv run reflex init prompts you to pick a template:
At the prompt, type 0 and press enter to pick A blank Reflex app, since every step here builds on that. Reflex also ships its own dashboard templates, worth a look once this one's built by hand.
After you initialize trading_dashboard, a list of files appears, but here's what matters for this tutorial:
More files show up too, from uv init and reflex init, safe to ignore. The one you'll edit is trading_dashboard/trading_dashboard.py.
Confirm the app runs
Now that the app is scaffolded, start the dev server:
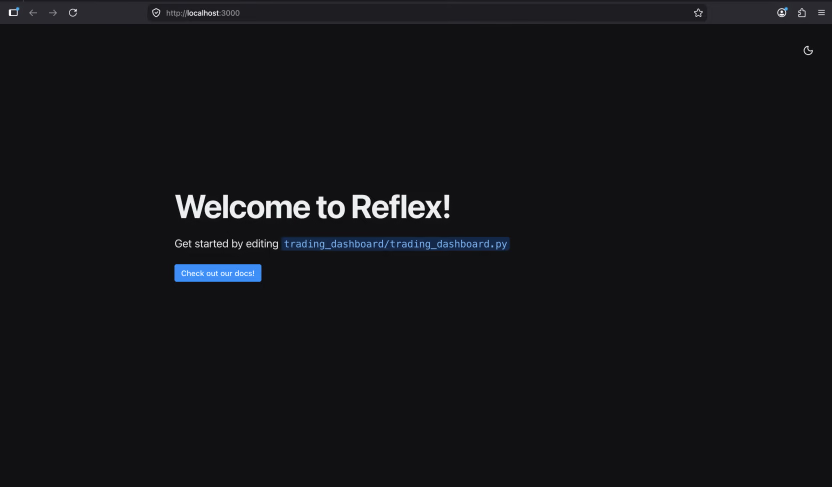
This starts two processes. A backend on port 8000 holds your state and runs your event handlers, and a frontend on port 3000 serves the UI. Navigate to http://localhost:3000. You should see Reflex's default welcome page.
Loading the page also creates a .states/ folder in your project, Reflex uses it to save this browser session. You won't see it in the file list from Step 1, since it didn't exist yet; it only appears once a page actually connects.
Reflex hot-reloads on save, so keep this terminal tab running throughout.
Add the Radix Themes plugin explicitly in rxconfig.py, since this tutorial's UI components are Radix-based.
Save the file. Reflex rebuilds automatically, so no need for a restart.
Step 2. Model the Dashboard State
Creating dashboards in Reflex starts with one Python class holding everything the dashboard shows. That's the whole idea behind Reflex's state model, worth understanding before you write more code.
Define the dashboard state class
In Reflex, a component reading a state var re-renders on its own whenever that var changes, no refresh logic of your own to write.
Open trading_dashboard/trading_dashboard.py, clear out the default welcome page, and start your state class:
The numbers above are starting values; Step 3 replaces them with values that move. The index() function is a placeholder, just enough to keep the file valid, and gets the real layout next.
Every var on a Reflex state class needs a type annotation, telling Reflex how to serialize the value and send it to the frontend. Without it, Reflex can't tell whether prices is a dict, a list, or something else, and can't get the data displayed correctly.
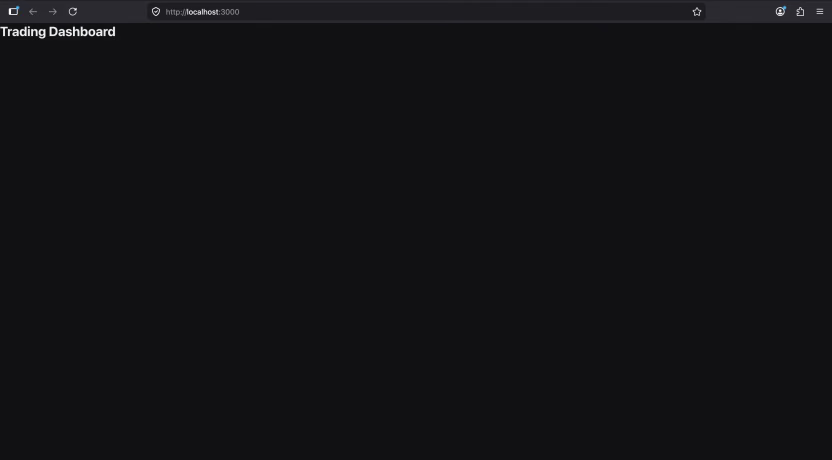
Save it. You should see a plain heading and nothing else, confirming the state class loaded without errors before you build on top of it.
Render the watchlist table in Reflex
Components can't loop over a state var with a plain Python for loop. The frontend compiles before the app runs, and Reflex doesn't yet know what's inside watchlist. Use rx.foreach instead.
Two new functions, watchlist_row and watchlist_table, plus an updated index(). Replace the whole file with this version:
ExpandCollapse
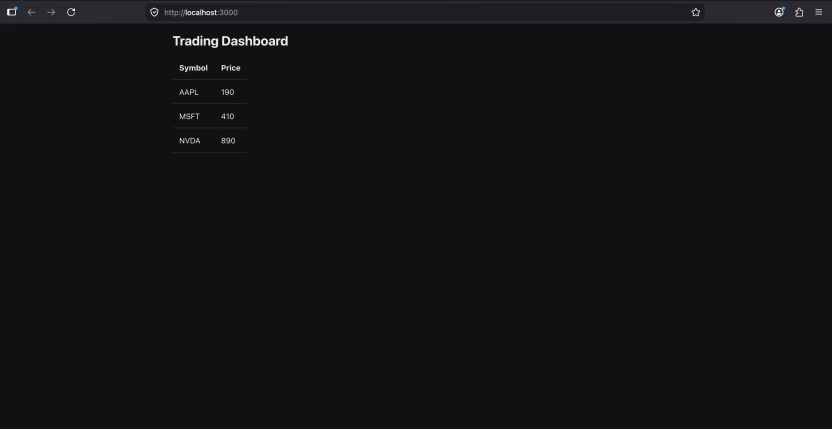
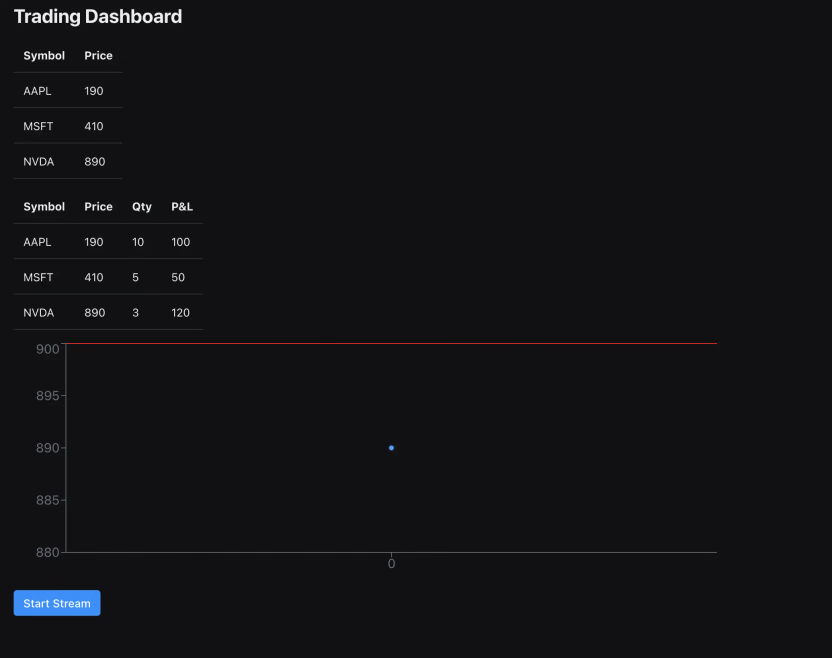
Once you save, Reflex hot-reloads and your watchlist renders as a static table: three symbols, three prices, no motion yet, exactly as expected. Motion comes next.
Step 3. Connect Live Data and Update in Real Time
Drag-and-drop tools like Tableau are built around pre-configured sheets and scheduled refreshes, not a polling loop you write yourself. In Reflex, that's a background task, which enables interactive dashboards with no page reload.
Why a background task
Reflex normally processes one event at a time, keeping state consistent and preventing two handlers from writing the same value at once. Every button press, keystroke, and form submission gets queued and handled in turn.
That's a problem for something that needs to keep running on its own. Loop forever inside a normal event handler, and every other event, including the one that would stop it, gets stuck behind it. A background task is the exception: a special event handler that runs alongside the others, not blocking them.
Add the streaming state and background event
This section grows your DashboardState class from Step 2. It adds a streaming flag, a price_history list for later, and two new methods, one to start and stop the stream, one to run it. Replace the imports and class at the top of your file with this version; everything below stays the same:
ExpandCollapse
Save it. Nothing changes on screen yet, since nothing calls stream_prices until the next section, but the file loads without errors.
Three new fields sit at the top: streaming tracks whether the feed is running. price_history starts with one entry, so the chart has something to plot from the first render. tick counts up as a state field, not a local variable. That way, it keeps climbing even if you stop and restart the stream, instead of resetting to zero each time.
toggle_stream is a plain event handler, @rx.event with no background flag. It flips streaming, then returns stream_prices to start the loop if that switched it on.
stream_prices is the background task itself, @rx.event(background=True) making it run alongside other events, not blocking them. State only changes inside the async with self: block, which locks it so nothing else writes while open.
The moment the block exits, Reflex pushes the change to the frontend. The asyncio.sleep(1) call sits outside the block on purpose, so the lock isn't held while waiting.
There's a second check right after the streaming flag: self.router.session.client_token not in app.event_namespace.token_to_sid. That app isn't defined in this fragment, it's the same app = rx.App() from index()'s section, further down in the same file. Without this check, closing the browser tab doesn't stop the loop, it runs forever checking a client that's gone. This is Reflex's own documented pattern for this exact case.
Wire up the trigger
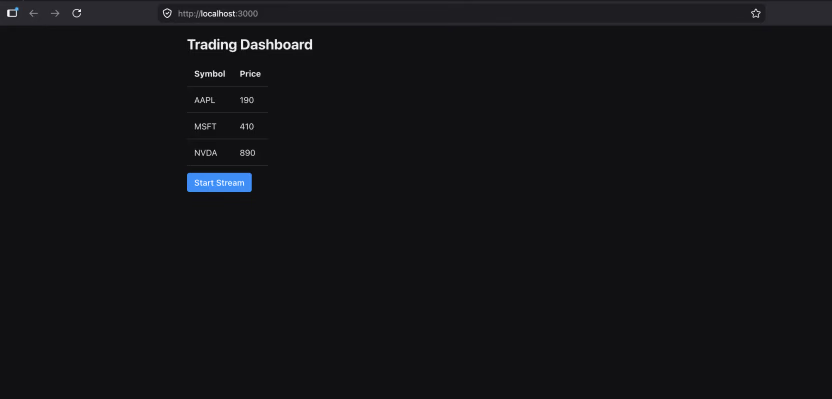
This is the one place users interact directly. Wire toggle_stream, defined above, to a button with on_click, inside index()'s rx.vstack, indented the same as watchlist_table(), right below it:
Save once the button's in place. The label uses rx.cond to switch its text based on streaming: "Stop Stream" while it's running, "Start Stream" when it's not. It works like an if/else, just built for a UI that updates itself. More on rx.cond in Step 5.
Run the stream
Select Start Stream in the browser. Prices tick on their own, roughly once a second, with no page refresh and no polling code in the frontend. The table just changes because the state it's bound to changed.
This tutorial uses a simulated feed so it runs without a paid key. Replace the random.uniform line with a query to your provider, inside the same async with self: block, if you want real data. Finnhub's free real-time tier works well here, though it allows only a handful of symbols per minute. Increase asyncio.sleep(1) to match your provider's limit if you switch.
Step 4. Compute P&L with Your Own Logic
This step uses custom Python to compute the analysis you need, the P&L logic defined directly in code rather than a BI tool's built-in formulas.
Add position data
P&L needs two more things: what you paid for each position, and how many shares you hold. Add entry prices and share counts to DashboardState. In a real app, this comes from a broker's API or database; here, it's hardcoded as a simple example, so no broker account is needed.
These two fields go at the bottom of your existing DashboardState class, right after price_history:
Save it. Nothing renders differently yet, since nothing reads these fields until the next section.
Write the P&L computation
The P&L math lives inside positions, a computed var on DashboardState that returns one row per symbol for the positions table. It goes below the fields you just added, indented the same as entry_prices and shares, since it's a method on the same class:
@rx.var(cache=True) marks positions as a computed var, recomputed only when prices changes, so you never call it yourself. That guarantees consistent metrics everywhere you read positions. The math is (price - entry) * qty, data relationships between three fields, just Python.
Bind the positions table
The table follows the same shape as watchlist_table, more columns to display data, one per field in each positions row. Both functions go below watchlist_table(), above def index():
ExpandCollapse
Now bring the new table into index(), right below watchlist_table(), keeping the same indentation:
Save, then start the stream again. Watch the P&L column recalculate on every tick, alongside the prices that drive it.
Step 5. Add the Chart and the Alert
Price streaming and P&L are both live on the dashboard now. The last piece is something visual: a live chart, plus a threshold alert that fires without you watching the screen.
Add the alert state
Next, add a threshold and the symbol it should watch. Both belong at the bottom of DashboardState, below the positions computed var from Step 4:
Save it here too, same reason: nothing visible changes until the chart and callout use it.
alert_triggered is a computed var. It reads a single source, prices, at the key alert_symbol instead of across the whole watchlist, compares that value against alert_threshold, and recalculates automatically whenever prices changes.
Build the live price chart
Reflex's charting components wrap Recharts directly. That's enough for real-time data visualization without a separate library. A live line chart is rx.recharts.line_chart, a line tied to a data_key, plus a reference_line to mark your threshold. This function goes below positions_table():
Binding data to DashboardState.price_history, the dataset behind the chart, makes it move on its own, the same reactive pattern as both tables. The reference_line component marks the threshold as a red dashed line on the chart, not just a caption underneath.
The y prop binds to DashboardState.alert_threshold, not a hardcoded number, so the line moves whenever the threshold does.
Add the threshold alert
Here, rx.cond takes the place of a plain if, the same compile-time reason rx.foreach replaces a for loop. Components can't branch on a state var using regular Python. This function goes below price_chart():
Bring threshold_alert() and price_chart() into index(), both go below positions_table(), in this order:
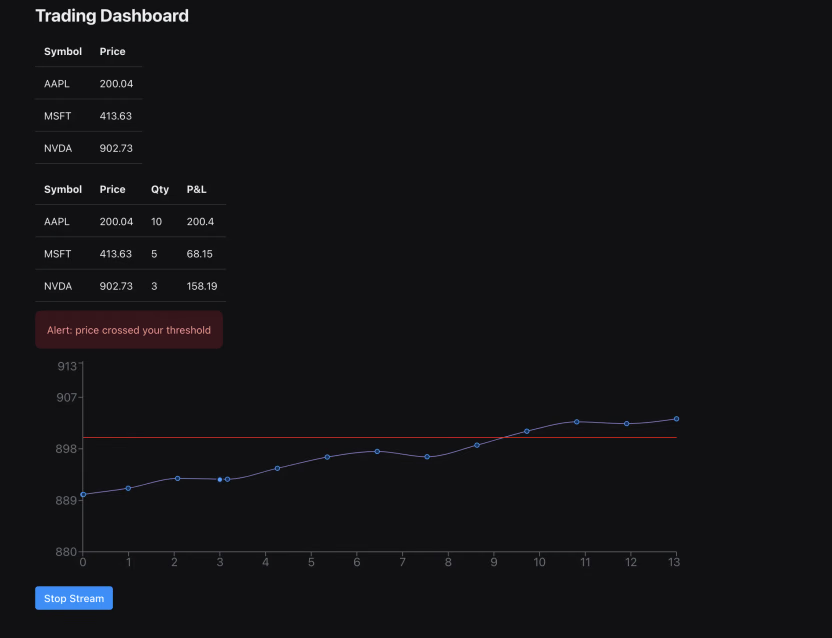
Save, then start the stream. Once NVDA's simulated price crosses 900, the callout appears; the chart's reference line was already waiting, both driven by the same alert_triggered var. Every piece is now in place.
Step 6. Run the Dashboard
Run uv run reflex run to see the entire dashboard: a watchlist, positions table, chart, and alert, all live. Here's what "done" looks like:
- Select Start Stream, and prices tick roughly once a second.
- The positions table's P&L recalculates on every tick.
- The chart's line moves; its reference line stays fixed at your threshold.
- The callout appears the moment the alert symbol's price crosses that threshold, and disappears if the price drops back below it.
If not, jump to Troubleshooting before moving on.
That's how to build a dashboard that reacts to live data
Nothing here needed a manual refresh. Every piece updates because the state it's bound to changed.
The complete file
Check your work against the complete trading_dashboard/trading_dashboard.py below, everything from Steps 2 through 5 in one file:
ExpandCollapse
Step 7. Deploy and Own It
This application deploys as a standalone app, not embedding dashboards inside someone else's product. Reflex is open source under the Apache 2.0 license; the source code stays in your project folder, hosted on infrastructure you control.
Deploy your dashboard with one command
Run this from your project directory, same as uv run reflex run:
The first run prompts you to log in or create a Reflex Cloud account, Reflex's own hosting platform. It then asks a few setup questions: dependencies, app name, and an optional description, before uploading and building. It's the same source code you've been running locally; the command packages and serves it publicly. Running it again later updates your published dashboard with whatever's changed.
Self-host instead
If you'd rather not use Reflex Cloud, then self-hosting works too, no paid add-on required. Clone your code to a server, install the requirements, and point api_url in rxconfig.py at that address. Then run uv run reflex run --env prod to start it, or containerize it with the provided Dockerfile and run anywhere containers already run.
On-prem, in a VPC, or air-gapped is just where you point it. Reflex documents enterprise-specific on-premises options separately: Reflex's on-premises deployment guide.
Troubleshooting
Connection issues, timeouts, or odd frontend errors
This one can look like three different bugs: a timeout message, a red connection icon, or JavaScript errors. The fixes are the same three things, in order of how often each causes issues.
Refresh the page first. Reflex starts a new backend process on every uv run reflex run, and an old tab can point to one that's gone.
If that doesn't work, then it's because the modified DashboardState shape can't load an older save. Clear it, then restart:
Prices aren't updating
Check if streaming changed to True, and if toggle_stream returned DashboardState.stream``_prices instead of just setting the flag. If that never happens, the prices stay unchanged, with no error to explain why.
State changes aren't showing up, or values look stale
Background tasks can only read or write state inside an async with self: block. Writing outside raises an error or never reaches the frontend, and reading outside risks a stale value if another handler changes it first.
The chart isn't rendering
Confirm data binds to DashboardState.price_history, not a plain Python list outside the state class. Reflex has no way to detect changed data outside state.
You're hitting rate limits, or you don't have an API key
Fall back to the simulated feed from Step 3. It's the same background-task pattern a real feed would use, no account setup or rate limits in the way.
Deploy keeps asking to create a new app
uv run reflex deploy matches your local app against Reflex Cloud projects by name. If the project has a different name from your local app_name, then the CLI won't recognize it. It keeps prompting you to create a new app. In the Reflex Cloud dashboard, open Settings, rename the project to match, then deploy again.
Wrapping Up
You now have a running, real-time trading dashboard, maybe your first dashboard built this way. It's live prices, a positions table with P&L, an updating chart, a threshold alert. All in pure Python, all code you own, and fully customizable since none of it lives behind someone else's UI.
What to do from here:
- Swap the simulated feed for a live market-data API, Finnhub's docs are a good start, free and real-time.
- Add more symbols, a second watchlist, or multiple dashboards for different strategies pulling from multiple data sources.
- Add authentication for multiple users, Reflex has native integrations with Google, Okta, and Clerk through configuration, not custom code.
Whichever you pick, start building your dashboard for free with Reflex and take it from there.