Introducing xy in Reflex Build
Connect a database to Reflex Build, describe the chart you want, and the agent reads your schema, writes the query, and builds the page. Charts render with xy.
TL;DR: Connect a database to Reflex Build, describe the chart you want, and the agent reads your schema, writes the query, and builds the page. Charts render with xy.
Users have always been able to create dashboards with charts in Reflex Build, by connecting to a database through the integrations tab and pulling in a charting library with the built-in PyPI installer.
However, many general-purpose charting libraries struggle at the scale people want from their dashboards, forcing teams to sample or aggregate data before charting it. That can make the full dataset harder to explore and create problems for data teams.
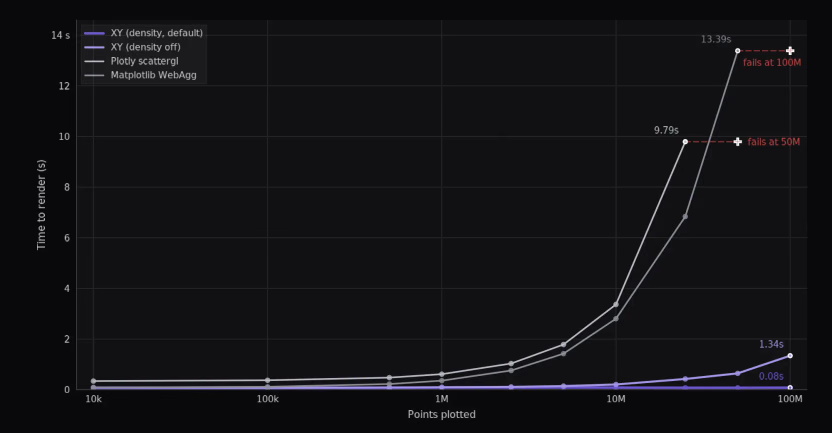
For this reason, we recently built and open-sourced xy, the most performant charting library, which draws only what the screen can show. In our published benchmark, xy rendered a density overview from 100 million source rows in 0.081 seconds—roughly the time Matplotlib WebAgg needed for 10,000 rows. At 10 million rows, xy produced a density PNG 523 times faster than Plotly/Kaleido's complete-marker PNG. xy has also demonstrated interactive visualization of more than 10 billion rows.
Now we are adding it into Reflex Build, so users can chart the entire table. Connect your database and ask Build to make a chart with xy. Plot every row within, zoom into any range and see every actual point in that range, and make your charts fit the visuals of your dashboard.
Connecting a database
Open the integrations panel and enter a hostname, port, username, password, and database name, then pick the database type: Postgres, MySQL, MSSQL, or SQLite. You can also connect Snowflake, Databricks, or another external database through the same integrations page.
Other databases that are not publicly reachable can be connected over an SSH tunnel. PostgreSQL accepts CA certificates and optional client certificate pairs, with CA-only or full-hostname verification. MSSQL supports server-certificate verification.
Every app can be provisioned with a managed Postgres database, which you can view and manage in the Database tab.
Creating the chart
An example prompt:
Use xy to chart revenue by region for the last four quarters.
The agent queries your database from the sandbox, finds the orders table, reads a sample of rows to see how region is spelled and which column holds the date, writes the query, and builds a page with a bar chart on it.
Follow-ups edit what the agent already wrote. Ask for the same chart split by product line and it revises the query. Ask for a heatmap and it changes the chart again.
Line, bar, scatter, area, histogram, heatmap, pie, donut, funnel, Sankey, box, violin, ECDF, polar, and radar charts are all available, with more arriving as they are added to xy.
The chart is a component
The chart itself exists as a Reflex component, so clicks, brush selections, and viewport changes return typed event payloads. Your event handler updates State, and every chart that depends on that State recomputes. Ordinary data updates do not remount the chart.
Other components can read the same State. Select three regions on the chart and a table below it can show those regions because both use the same variable. A form on the same page can write to the chart's database and trigger a refresh.
Deploying
Deploy your dashboard to Reflex Cloud with the Deploy button in the top right. On a Reflex Enterprise plan you can also deploy to your company's own AWS, GCP, Azure, or Databricks environment, where enabled.
Availability
xy in Reflex Build is available on every Reflex plan, including free. Connect a database in the integrations panel and ask for an xy chart at build.reflex.dev.