In this tutorial, you'll build a data dashboard application that displays employee information in both table and chart formats, with interactive features for filtering and adding new data. We'll also add a simple chatbot page to demonstrate multi-page navigation.
By the end of this tutorial, you'll have created:
- A dashboard displaying employee data in a table and bar chart
- Interactive filtering to search through your data
- A modal form for adding new employees
- A separate page with a simple chatbot interface
This tutorial assumes you're starting with a new project in AI Builder.
Let's start by building the core of our application - a dashboard that displays employee data.
Prompt:
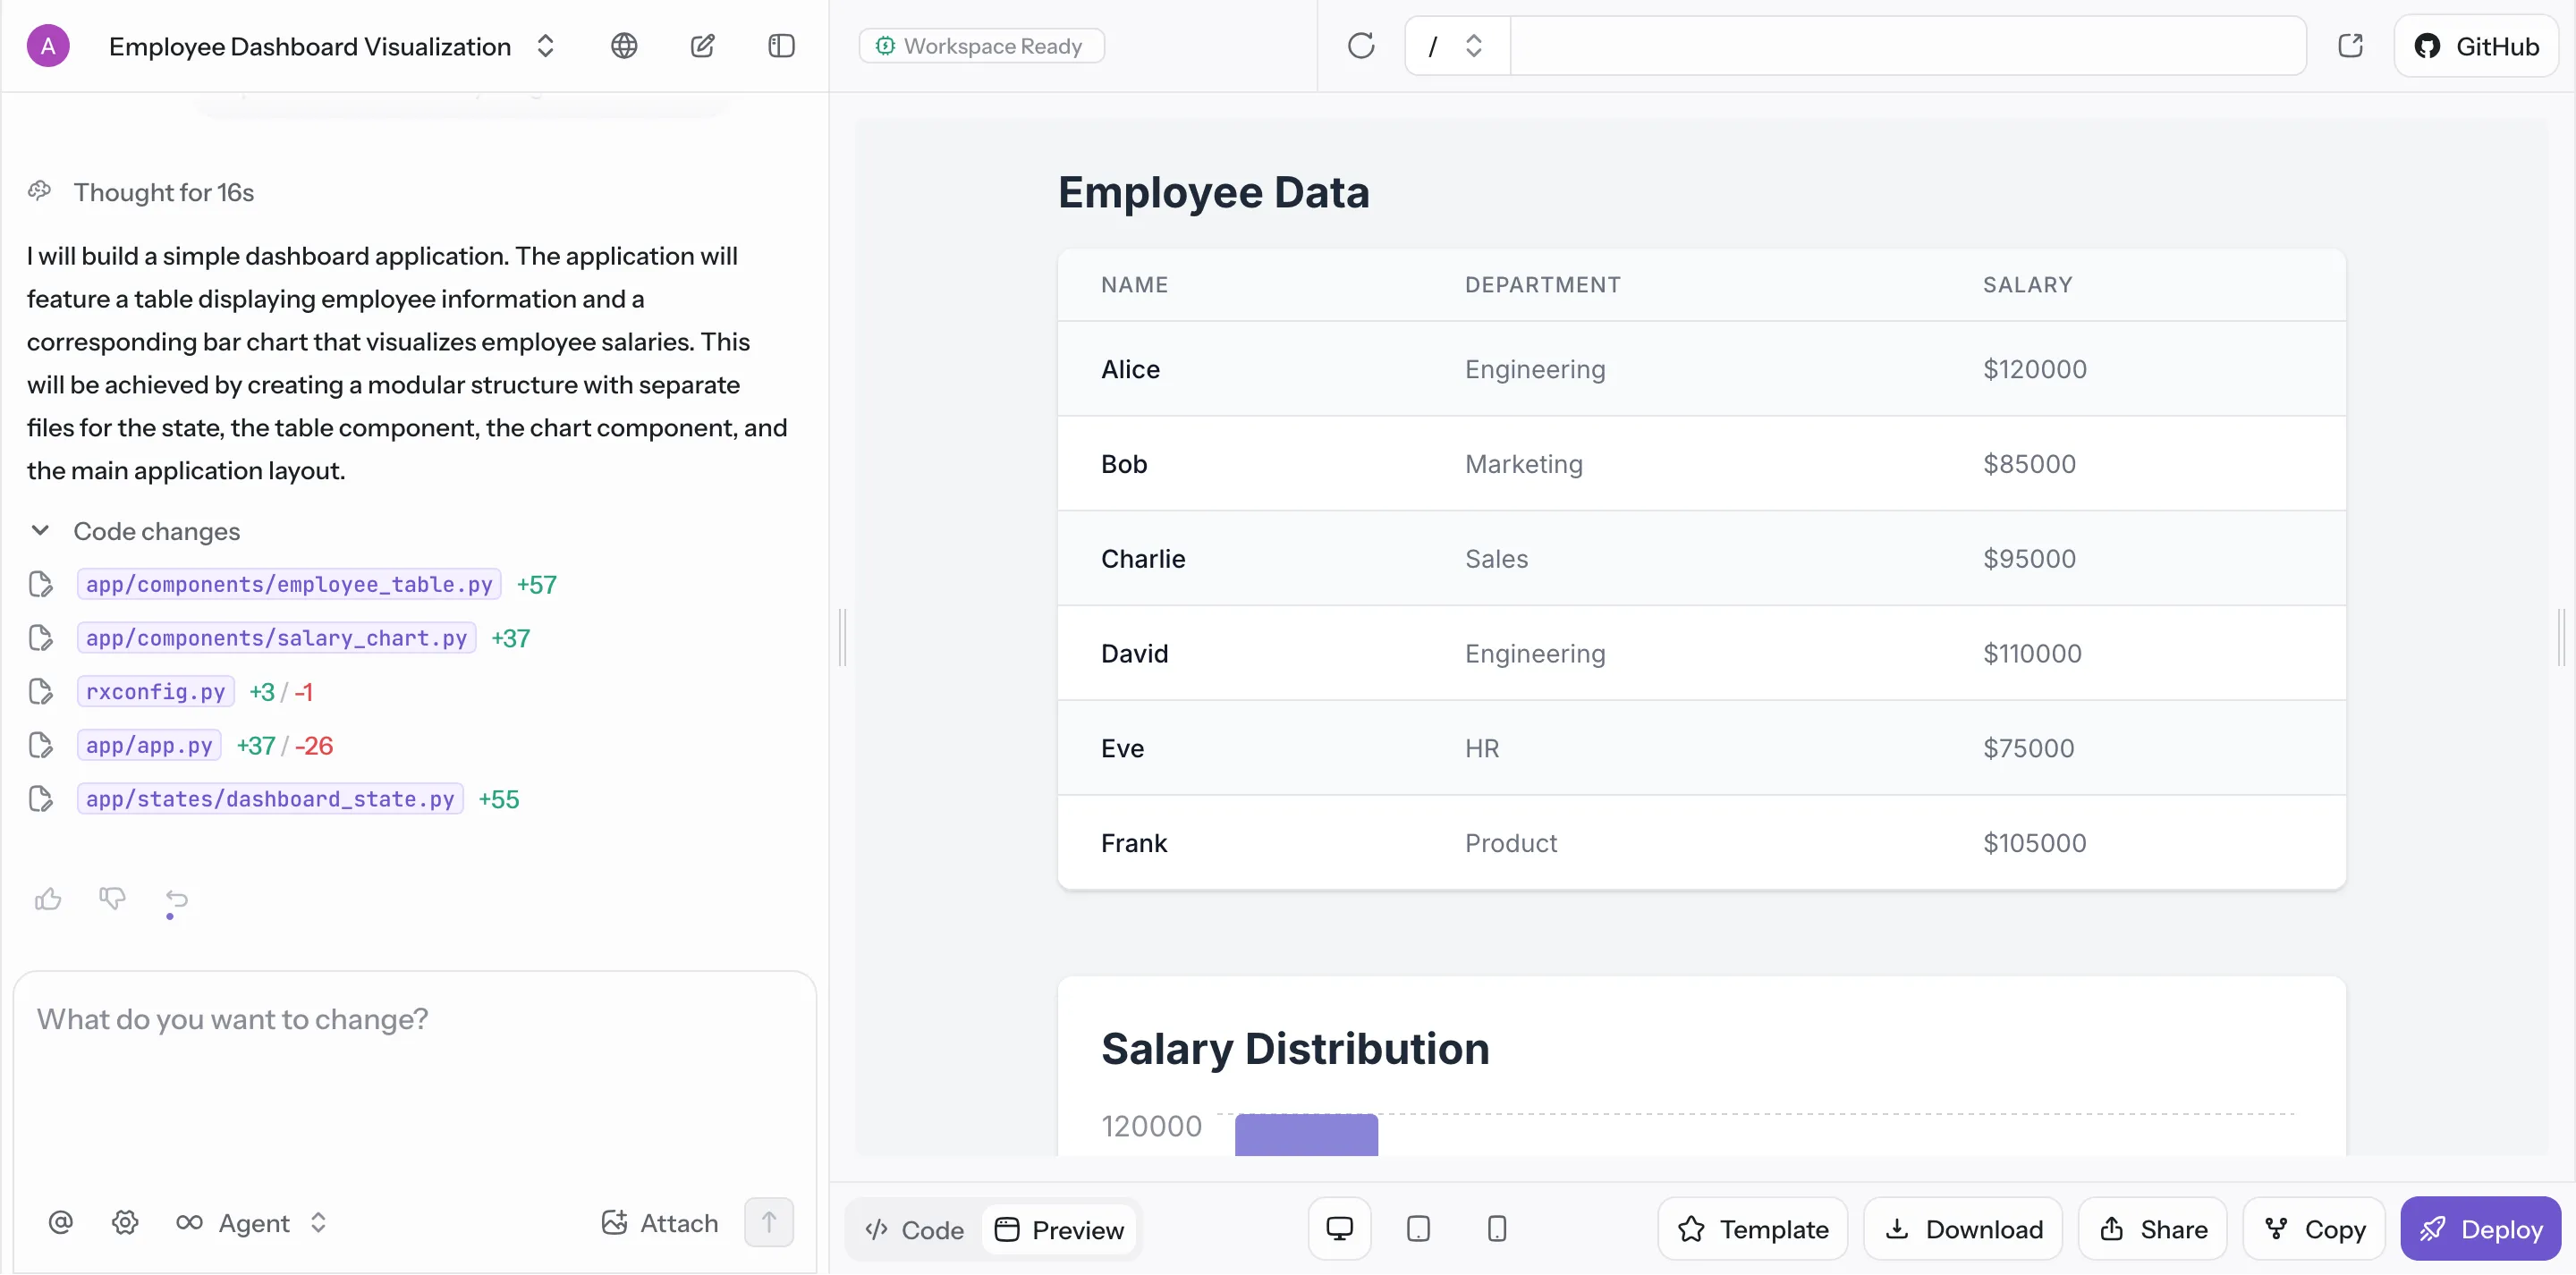
This will create your main dashboard page with both tabular and visual representations of your data. The AI will generate sample employee records and create a bar chart that makes it easy to compare salaries across your team.

Now that you have your basic dashboard, let's make it more interactive by adding the ability to filter and search through your employee data.
Prompt:
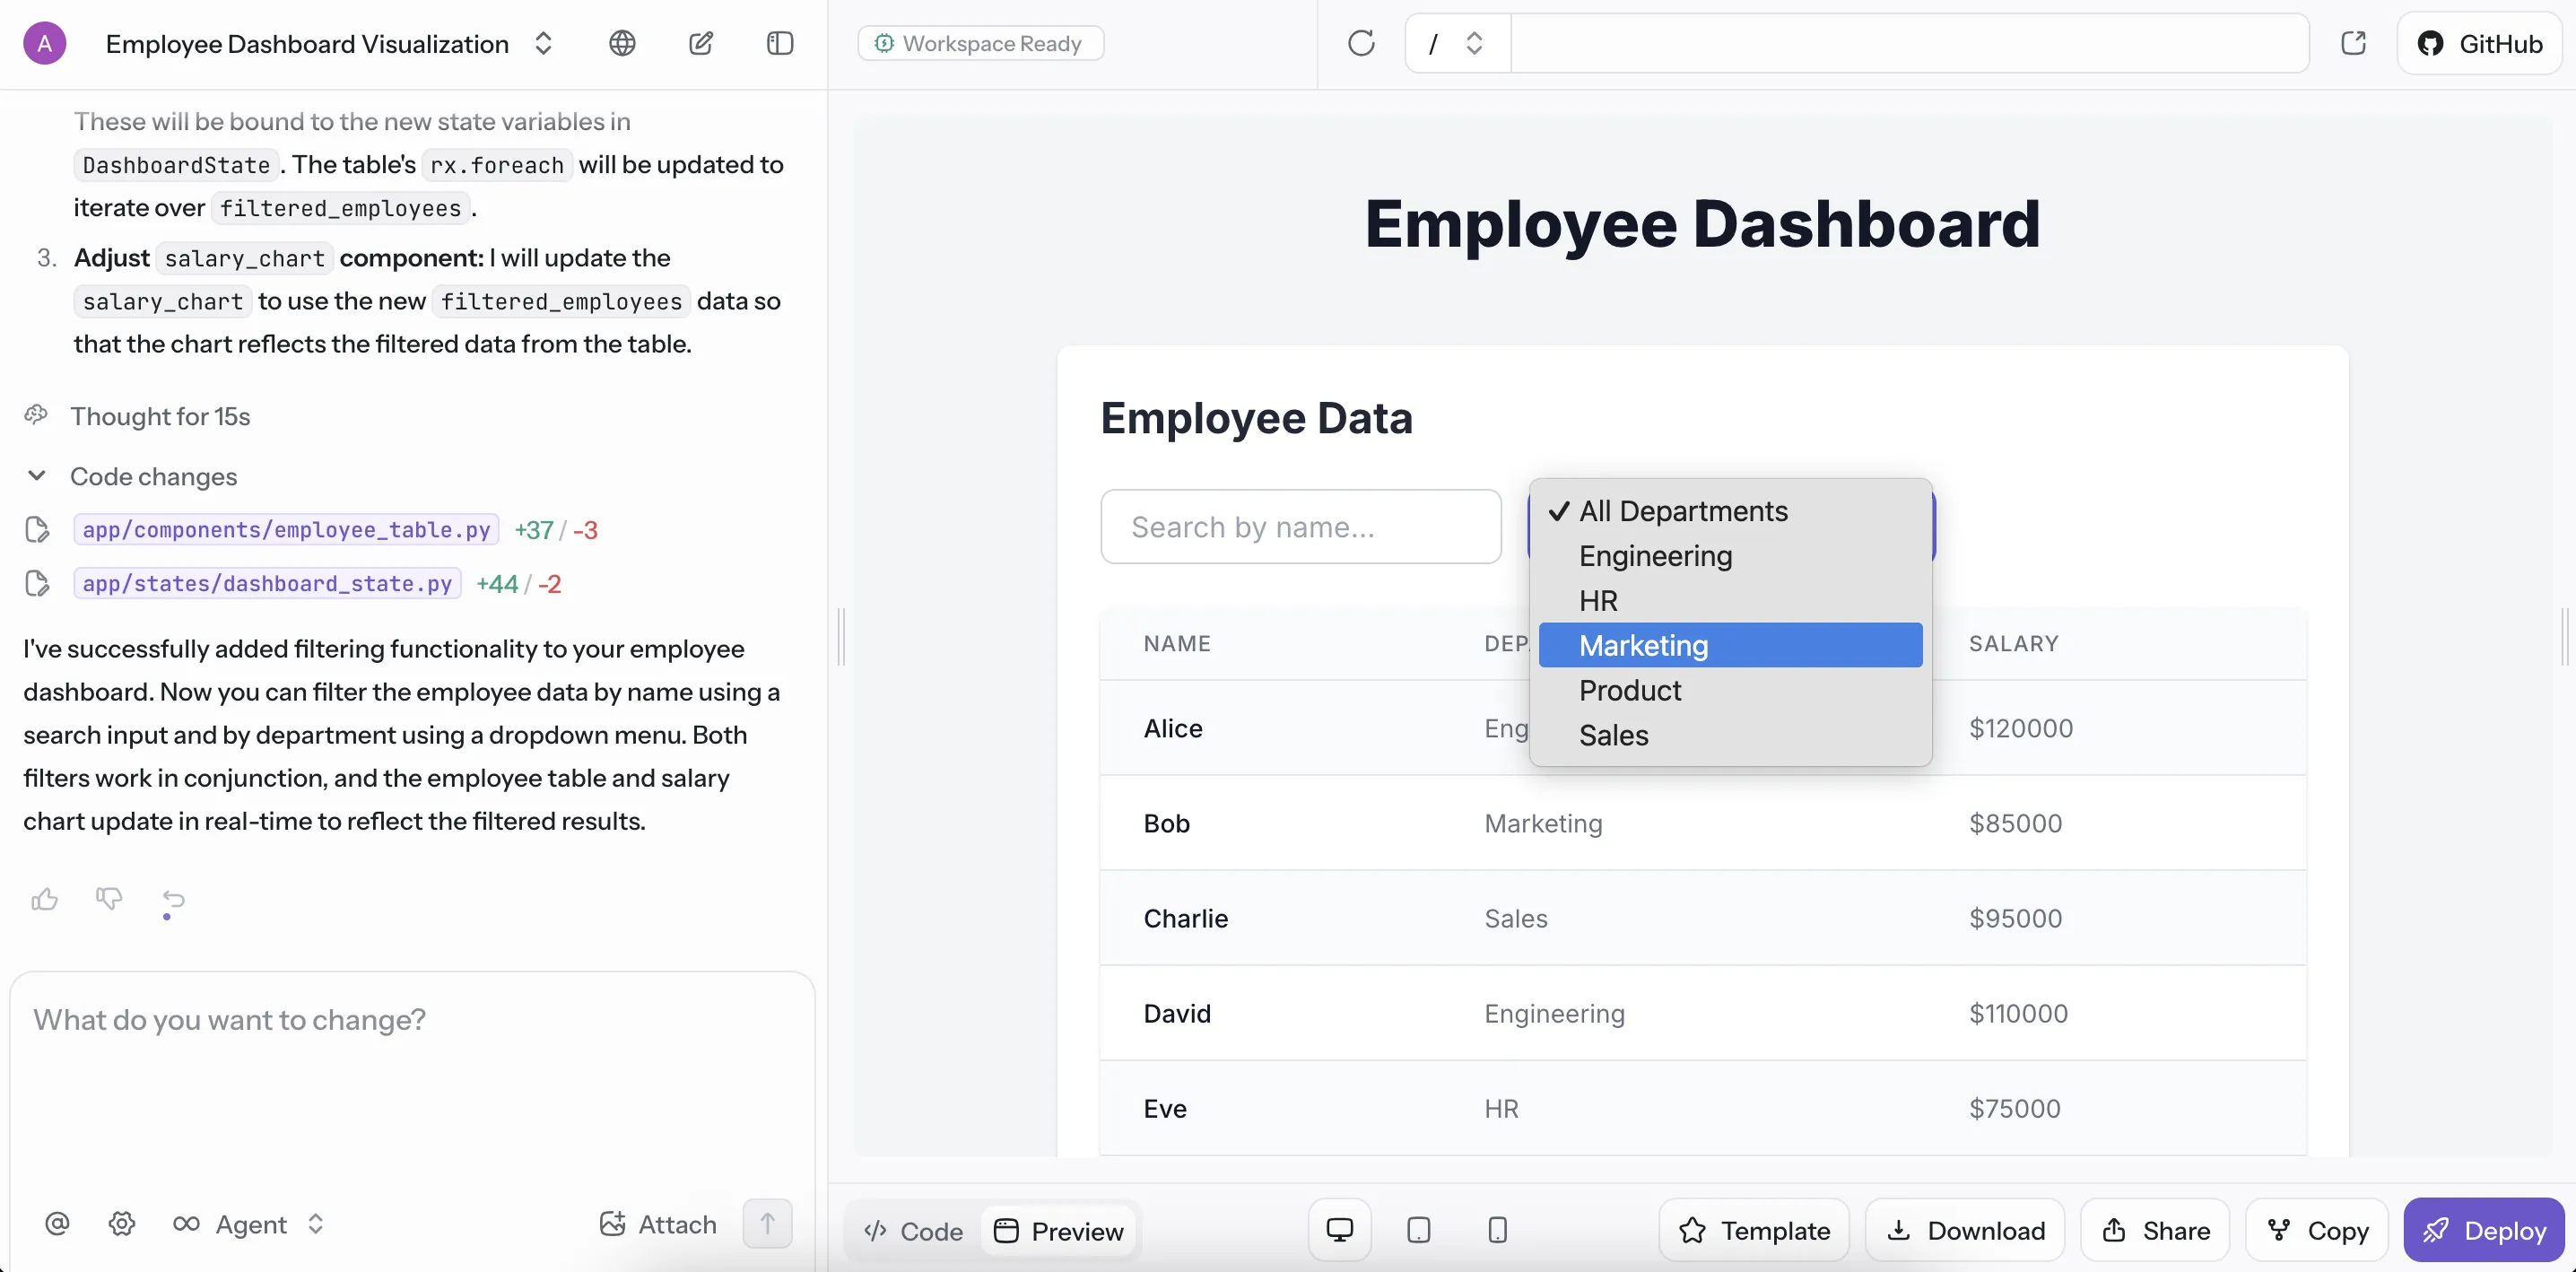
Your dashboard now becomes much more useful with real-time filtering. Users can quickly find specific employees by name or narrow down results by department. The filters work together, so you can combine a department filter with a name search.

A static dashboard is useful, but being able to add new data makes your app much more practical. Let's add the ability to create new employee records.
Prompt:
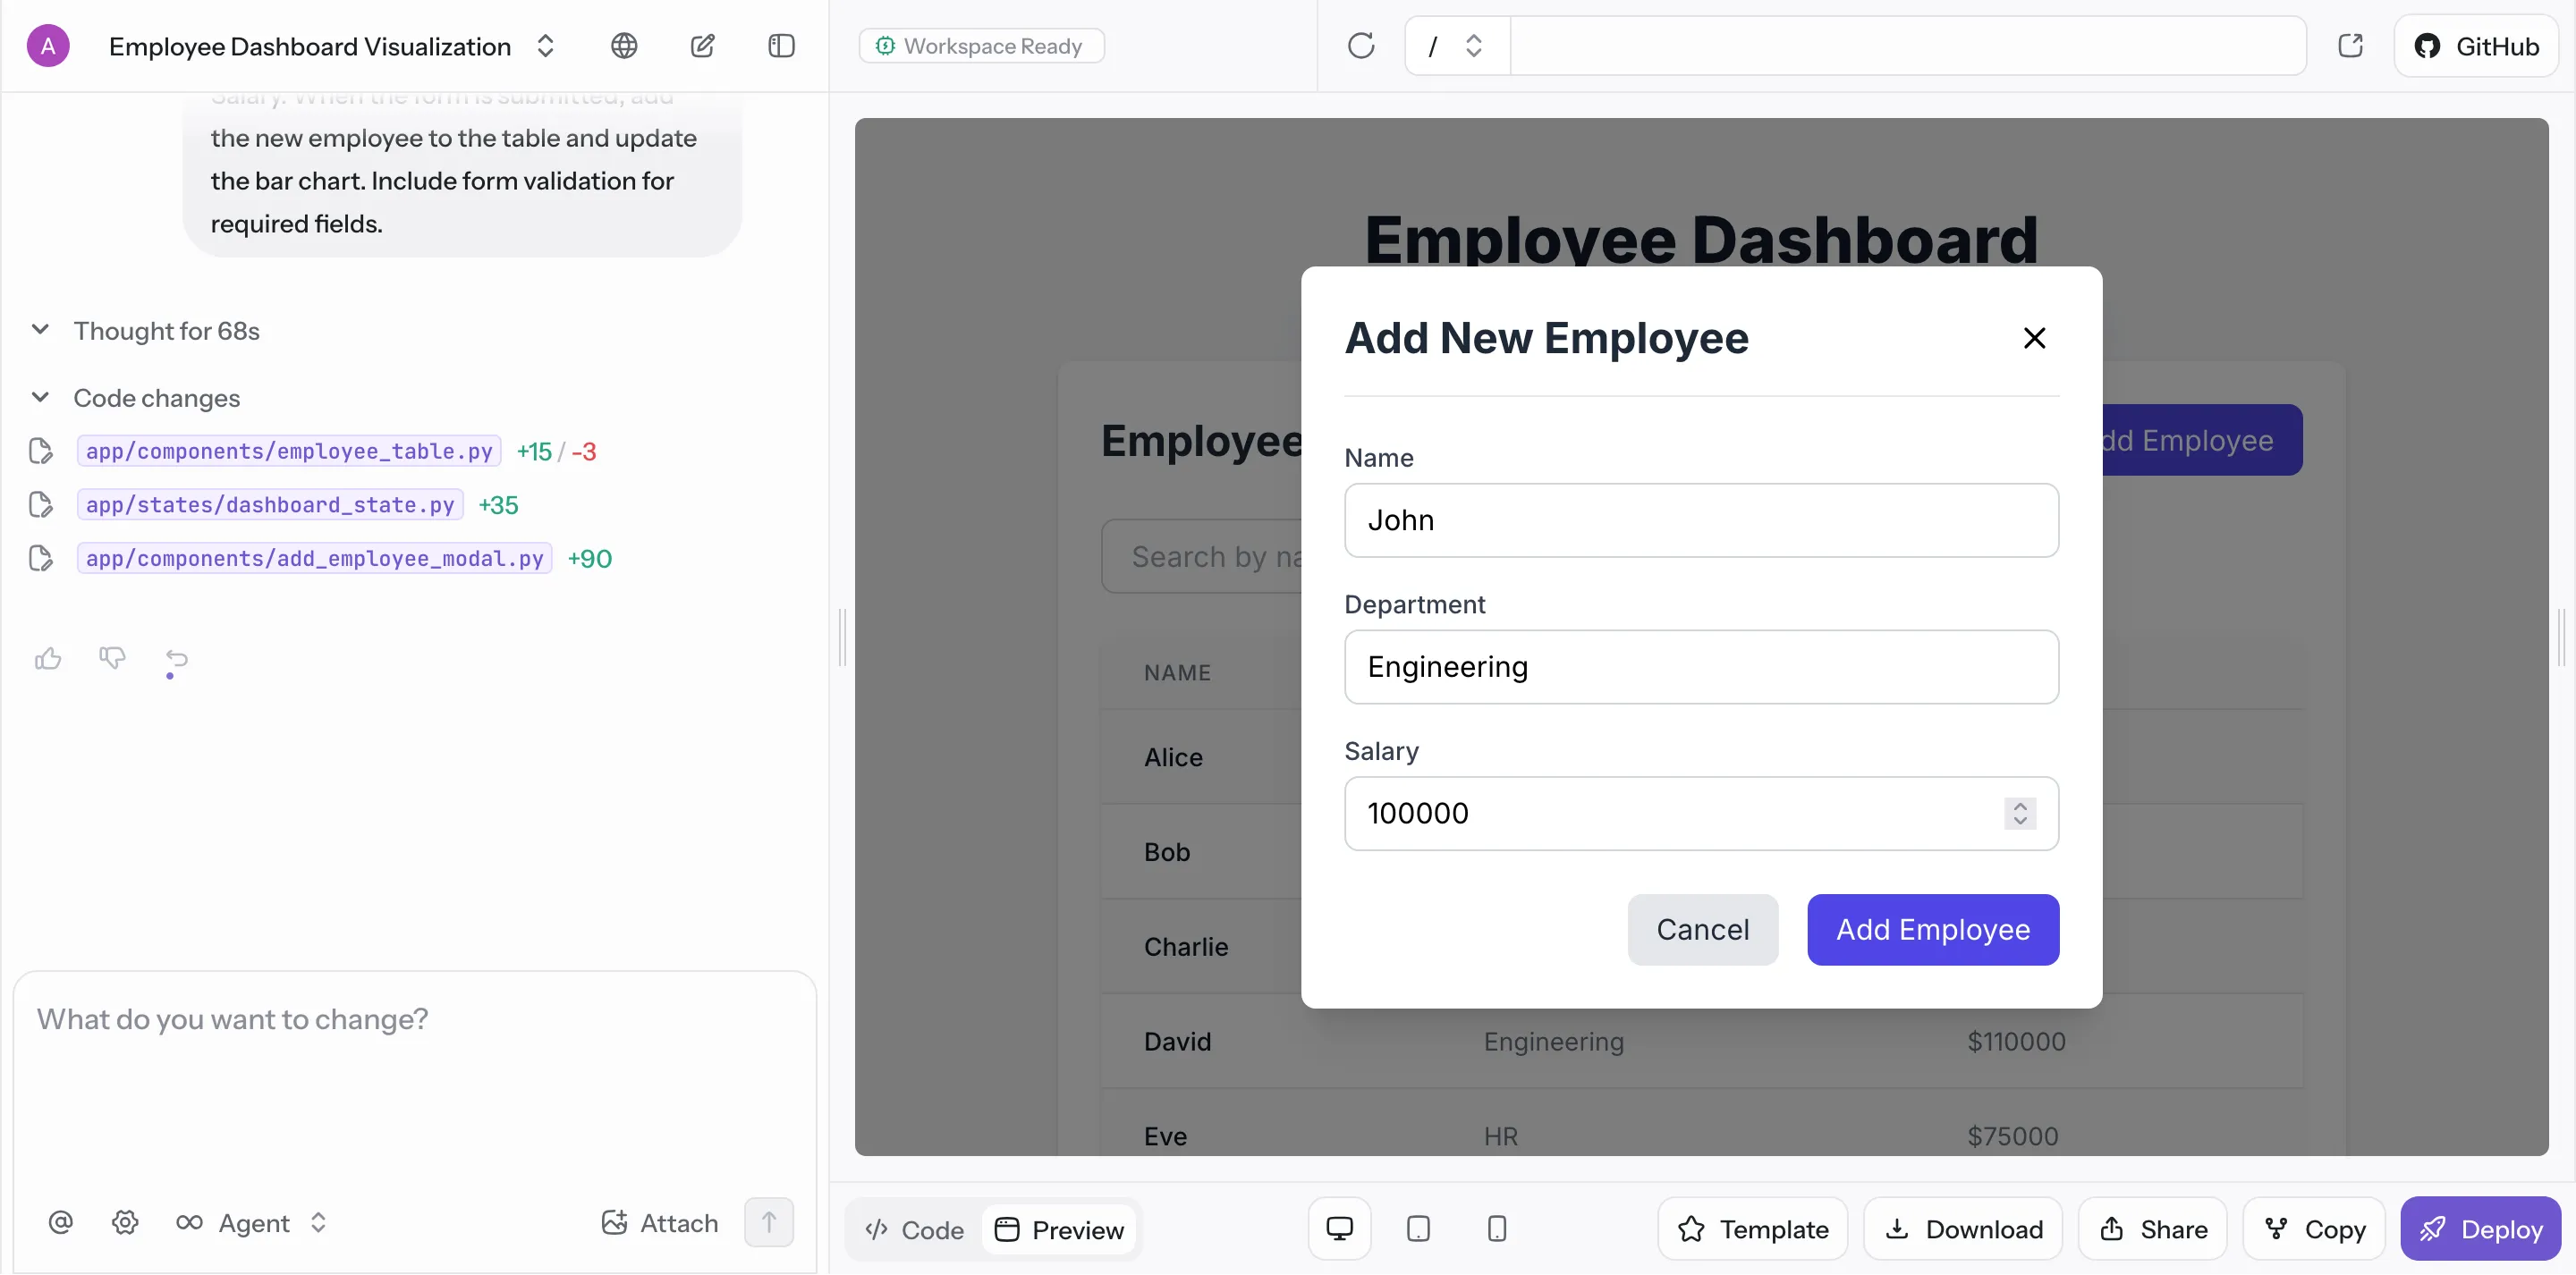
Your app now has full CRUD capability for employee records. The modal form provides a clean interface for data entry, and both your table and chart update immediately when new employees are added.

Most real applications have multiple pages. Let's add a chatbot page to demonstrate navigation and create a more complete user experience.
Prompt:
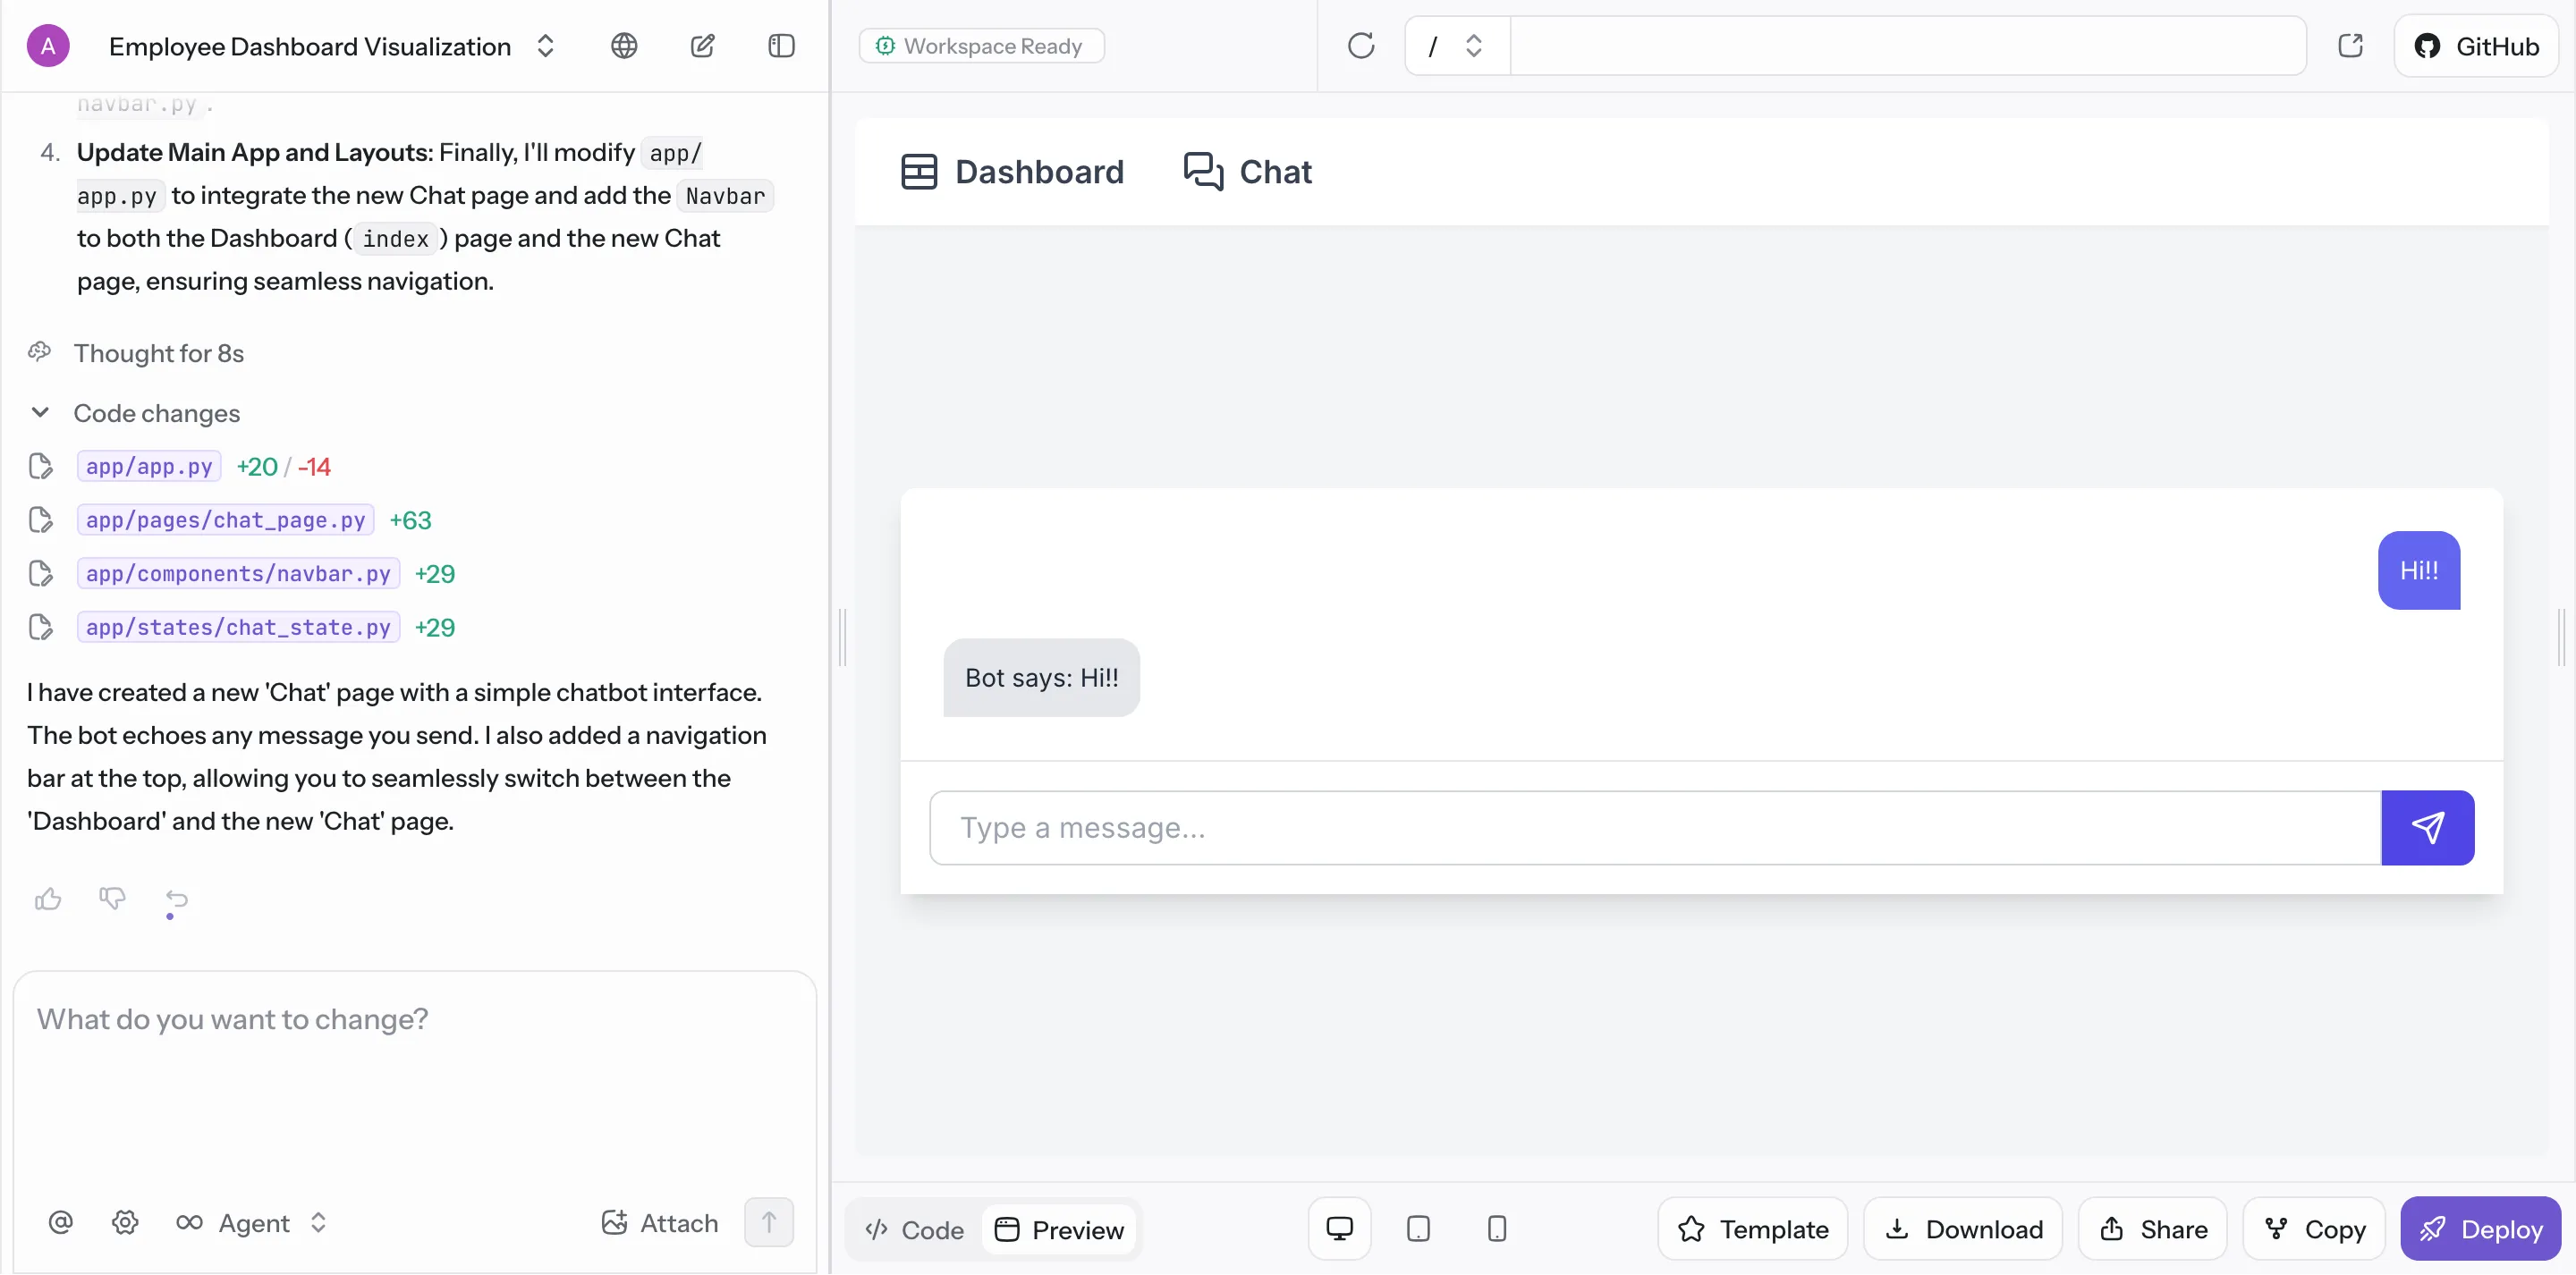
Your app now has proper navigation between the dashboard and chat functionality. The chatbot page demonstrates how easy it is to add new features and pages to your AI Builder application.

You've successfully built a complete web application with data visualization, interactive filtering, data entry, and multi-page navigation. Your app demonstrates many common patterns used in modern web applications:
- Data presentation with tables and charts
- User interaction through filtering and forms
- Real-time updates when data changes
- Multi-page architecture with navigation
Now that you have a working foundation, try experimenting with these ideas:
- Customize the data model - change the employee fields or add new columns
- Enhance the visualizations - try different chart types or add more charts
- Improve the chatbot - give it more sophisticated responses or integrate it with your employee data
- Add more pages - create additional features like employee profiles or reporting dashboards
The power of AI Builder is that you can iterate quickly with natural language prompts. Each new feature is just a conversation away!