


Python for Finance: Building Production-Grade Apps for Quant Teams and Financial Institutions (June 2026)
Build production-grade Python finance apps for quant teams and financial institutions. Learn deployment, authentication, and risk modeling in June 2026.
 Tom Gotsman
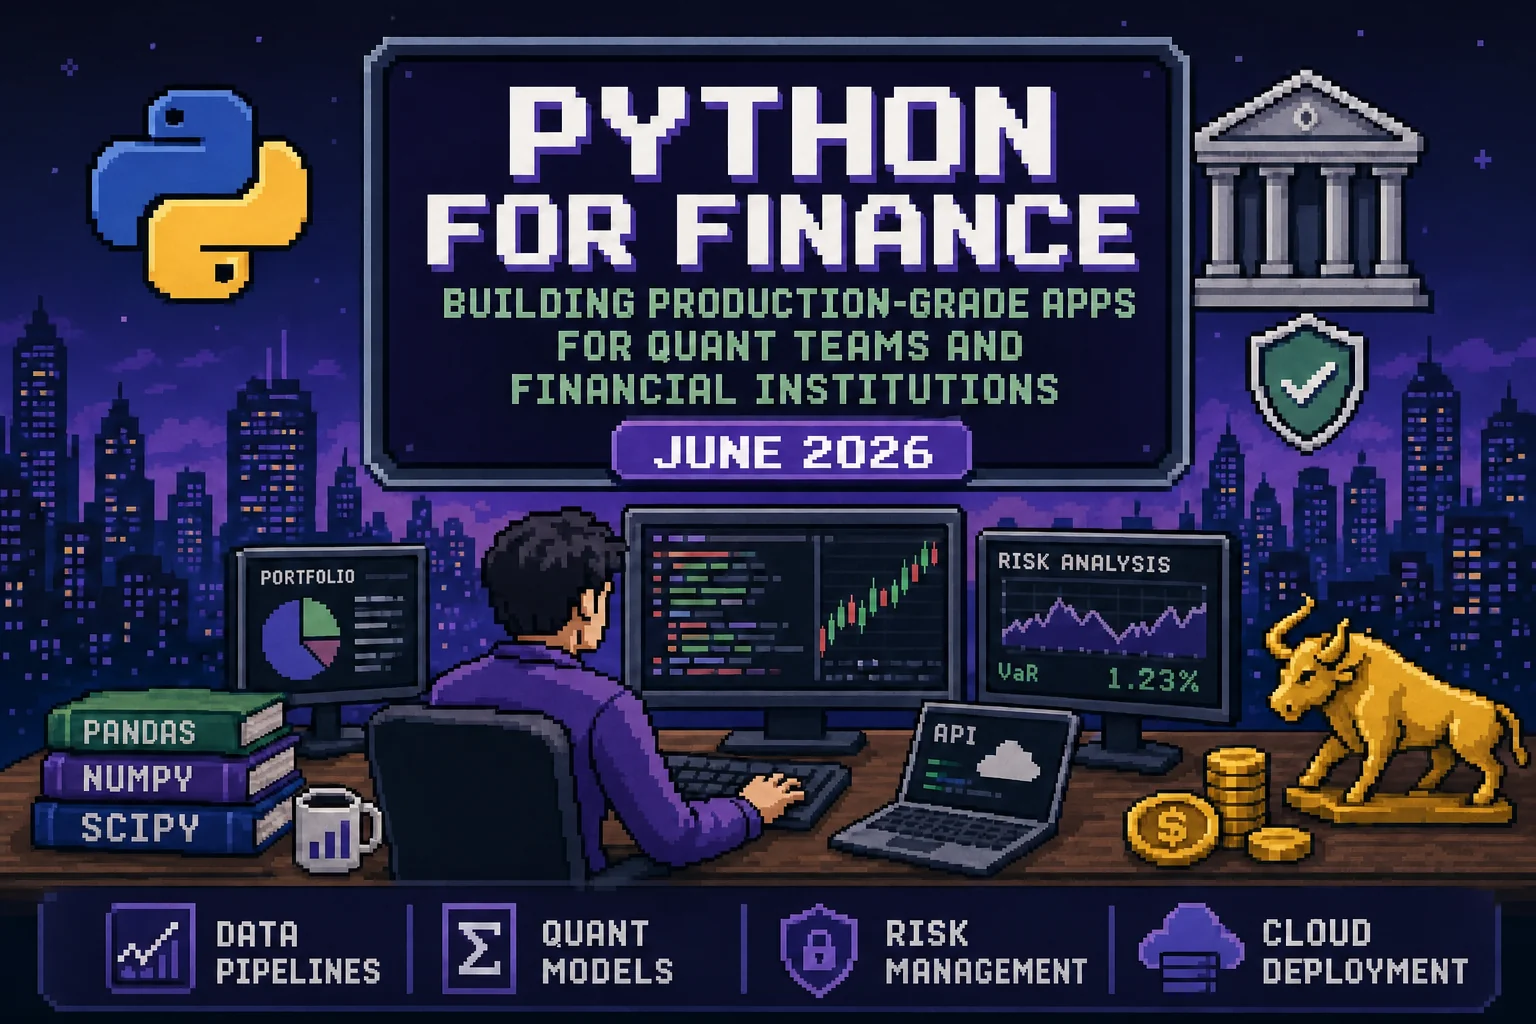
The divide between quant modeling and production delivery has long been Python's biggest friction point in finance. A team can build a sophisticated risk engine or pricing model in Python, then spend weeks handing it off to a frontend team or rebuilding it in a separate tech stack before anyone can actually run it. What changed in 2026 is how quickly that gap can be closed: frameworks like Reflex let quant teams build full-stack tools, including dashboards, internal tools, and client-facing analytics, entirely in Python. Institutions can now ship faster, cut reliance on fragmented tech stacks, and bring production-grade financial workflows to life without leaving the Python ecosystem.
TLDR:
- Pandas and NumPy handle time-series data, portfolio math, and volatility calculations in a few lines of code.
- Monte Carlo simulation with 50,000 paths gives you VaR and Conditional VaR for tail-risk measurement.
- 92% of Forex trading is automated; backtesting with Sharpe ratio and max drawdown validates strategies before deployment.
- Production financial apps require authentication, row-level database permissions, and secrets management for compliance.
- Reflex builds full-stack Python dashboards where risk engines plug in as native imports with backend state management.
Core Python Libraries for Financial Analysis
Before writing any code, map each task to the right tool. Here's the stack most production quant teams run.
| Library | Purpose | Key Methods / Features | Best For |
|---|---|---|---|
| pandas | Data manipulation and time-series analysis | fillna, resample, pct_change, rolling windows | Cleaning market data, return calculations, date indexing |
| NumPy | Vectorized numerical computing | Array operations, matrix math, random number generation | Portfolio covariance, Monte Carlo simulation paths |
| scipy.stats | Statistical analysis | Distribution fitting, hypothesis tests, percentile functions | VaR confidence levels, return distribution modeling |
| statsmodels | Econometrics and forecasting | OLS regression, cointegration tests, ARIMA | Factor modeling, pairs trading signal generation |
| yfinance | Market data retrieval | Pulls OHLCV data directly into a DataFrame | Rapid prototyping with real historical price data |
| Plotly | Interactive data visualization | Candlestick charts, volume overlays, zoomable time axes | Portfolio dashboards, client-facing analytics |
| PyPortfolioOpt | Portfolio optimization | Efficient frontier, Black-Litterman, hierarchical risk parity | Weight allocation with transaction cost constraints |
The awesome-quant repository on GitHub maintains a curated list of quantitative finance libraries worth bookmarking.
Data Analysis and Visualization for Financial Markets
Raw market data rarely arrives clean. Missing values, stock splits, and misaligned timestamps all need handling before any analysis makes sense. Pandas' fillna, resample, and pct_change methods cover most cases in one or two lines.
For visualization, Matplotlib handles static charts well, but Plotly gives you interactive candlestick charts, volume overlays, and zoomable time axes that portfolio managers actually want to use. For a deeper comparison of Python visualization libraries, see our full guide. Plotly figures also embed naturally into web apps later.
A single interactive chart replaces the static screenshots that still get passed around in most equity research teams. Once your data is clean and visualized, the next step is usually modeling the relationships you can see in those charts.
Financial Modeling and Portfolio Optimization
Modern Portfolio Theory reduces to a bounded optimization problem: maximize return for a given risk level, or minimize variance for a target return. Python's scipy.optimize.minimize handles this once you have a covariance matrix and expected returns vector.
By sweeping across target returns and solving for minimum variance at each point, you trace the efficient frontier. Libraries like PyPortfolioOpt wrap this workflow with built-in support for Black-Litterman views, hierarchical risk parity, and transaction cost constraints, so you don't have to rebuild everything from scratch.
Risk Management and Monte Carlo Simulation
Value at Risk (VaR) answers a deceptively simple question: how much could you lose over a given horizon at a specific confidence level? Fat tails in real markets make Monte Carlo simulation a more reliable answer than the parametric approach for most desks.
Running 50,000 paths across a 10-day horizon gives you both VaR and Conditional VaR (expected shortfall), which captures tail severity beyond the threshold alone. Stress testing layers on top by shocking specific inputs like correlation spikes, rate jumps, or liquidity freezes, then re-running the simulation to see how portfolio losses compound under those scenarios.
Algorithmic Trading and Backtesting Strategies
92% of Forex trading is now automated. Python dominates strategy development because Pandas and NumPy plug directly into backtesting frameworks like Backtrader and vectorbt. Define entry/exit rules, run them against historical data, then measure Sharpe ratio, max drawdown, and win rate.
This moving average crossover is deliberately simple, but the pattern scales. Swap in RSI thresholds, Bollinger Band breakouts, or mean reversion z-scores and the evaluation logic stays the same. The key rule: never skip the backtest. A strategy that looks clever on a whiteboard can blow up once transaction costs and slippage enter the picture.
Production Requirements for Financial Applications
Jupyter notebooks work for research. They fail as production systems. Shipping a financial app an institution trusts requires authentication, audit logging, role-based data access, and database connections that don't expose credentials in plaintext.
A production financial app needs, at minimum:
- User authentication: tie login to your identity provider (Okta, Azure AD, or similar) so access is centrally managed and auditable
- Row-level database permissions: restrict analysts to only their own book's positions (see our guide on PostgreSQL dashboards for implementation details)
- Background job processing: run batch risk calculations off the main thread so heavy computations never block the UI
- Secure secrets management: store API keys to market data vendors outside the codebase using a dedicated secrets store
Compliance teams at compliance-driven firms will reject anything that lacks these controls, regardless of how good the underlying analytics are. Building applications with proper access controls is critical for passing audits. Getting the architecture right from the start saves months of retrofitting later.
Deployment and Infrastructure for Financial Systems
Getting a financial app into a compliance-governed production environment requires CI/CD pipelines with dependency audits and secret scanning before code reaches a server. Most quant teams wire this through GitHub Actions or GitLab CI with gated approvals.
Monitoring matters more in finance than in most domains. A silent failure in a pricing service can cascade into real losses. OpenTelemetry tracing, log aggregation, and alerting on latency spikes should be configured from day one, not bolted on after an incident.
For firms with strict data residency rules, VPC or on-premises hosting is non-negotiable. Multi-region deployment helps with failover and latency for globally distributed trading desks.
Building Production-Grade Python Apps for Finance Teams With Reflex
Quant teams write Black-Scholes pricing models, Monte Carlo risk engines, and alpha signal generators in Python, yet getting those models in front of portfolio managers usually means hiring a frontend team or exporting a static notebook. 40% of Fortune 500 companies now build production-grade web apps in pure Python with Reflex, including finance and compliance-driven teams that need on-prem deployment and auditable source code. Bayesline, a YC-backed equity factor risk analytics firm founded by ex-BlackRock and Bloomberg engineers, is one example: the team was 4x faster shipping their production app in Reflex compared to learning React, with no frontend engineer hire needed.
Building a Python web app with Reflex means the same engineers who wrote the risk engine also ship the dashboard. The model and the interface live in one Python codebase, with no handoff to a frontend team and no static notebook export.
The snippet below shows how a VaR risk calculation plugs into a Reflex dashboard. The state class holds the result. A background event handler runs the heavy computation off the main thread. The UI binds directly to the state variable. No API layer, no serialization, no JavaScript. The Reflex core graphing components support all major financial chart types out of the box.
All state lives on the backend, so existing pricing models, data pipelines, and risk engines plug in as regular Python imports with no middleware or serialization layer. For a worked example of connecting real-time financial data, see the guide on building a dashboard with a database. Deployment supports on-premises and VPC hosting for firms with data residency requirements, with built-in RBAC so compliance teams stay comfortable.
The output is readable Python your team can debug at 2 a.m. when a position report looks wrong. No React knowledge required.
Final Thoughts on Python for Financial Analysis and Trading Systems
The Python stack covered here, from Pandas and NumPy through Monte Carlo simulation and backtesting, gives quant teams the building blocks to model, measure, and validate financial risk. The next step is getting that work in front of the people who need it, without rebuilding it in a separate tech stack. Reflex closes that gap, letting the same team that built the models ship the dashboard, entirely in Python, without a handoff or a rewrite.
FAQ
What Python libraries do I need for quantitative finance analysis?
Start with pandas (time series and DataFrames), NumPy (vectorized math), and yfinance (market data). Add scipy.stats for distribution fitting, statsmodels for regression and cointegration tests, and Plotly for interactive charts. For portfolio optimization, PyPortfolioOpt wraps scipy.optimize with built-in support for Modern Portfolio Theory, Black-Litterman views, and transaction costs.
How do I calculate Value at Risk using Python?
Run a Monte Carlo simulation with NumPy by generating thousands of random return paths based on your portfolio's mean and standard deviation, then calculate the percentile threshold at your confidence level. For a 95% VaR over 10 days with 50,000 simulations, you get both VaR and Conditional VaR (expected shortfall) that captures tail severity beyond the threshold alone.
Can I build production financial apps without JavaScript?
Yes. Reflex lets you build full-stack financial applications entirely in Python, including interactive dashboards, real-time risk monitors, and multi-page portfolio management systems. The same Python code that defines your pricing models and risk calculations becomes the web interface, with no JavaScript required.
How do I deploy a Python trading system to production?
Your production system needs user authentication tied to your identity provider, row-level database permissions so analysts see only their desk's positions, background job processing for batch calculations, and secure secrets management for API keys. Run CI/CD pipelines with dependency audits and secret scanning, then deploy with monitoring through OpenTelemetry tracing and log aggregation from day one.
More Posts

What vibe coding is, how it works, and whether it's right for you. A developer guide covering tools, risks, and alternatives in 2026.
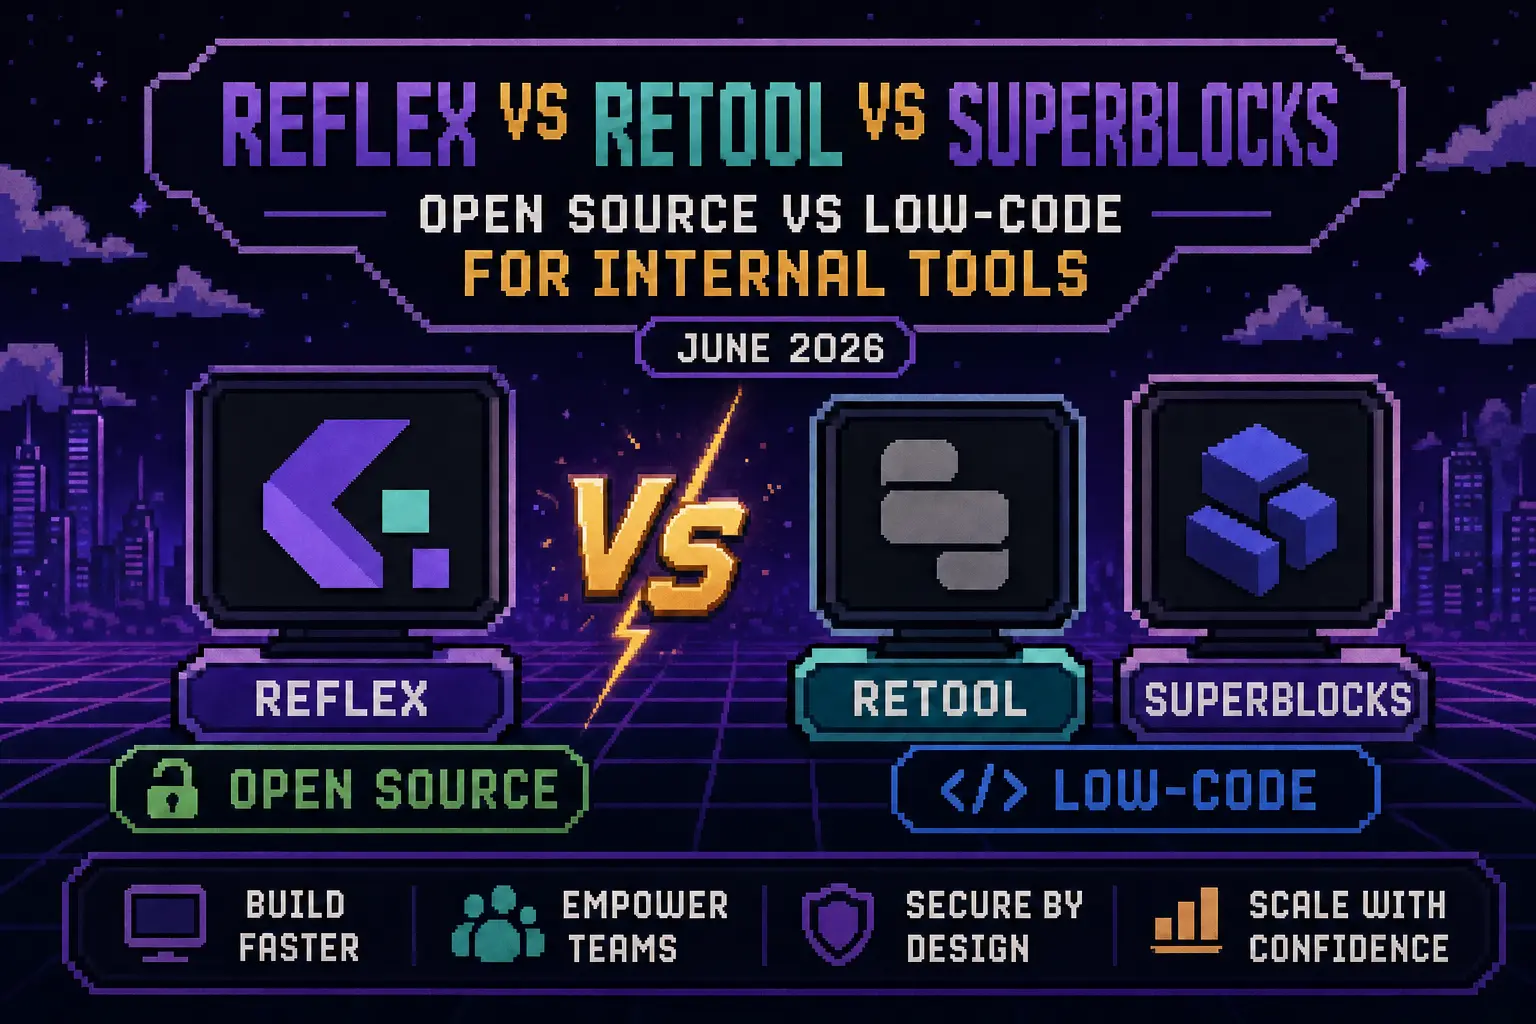
Compare Reflex vs Retool vs Superblocks for internal tools in June 2026. Learn which open source or low-code builder offers true code ownership and flexibility.
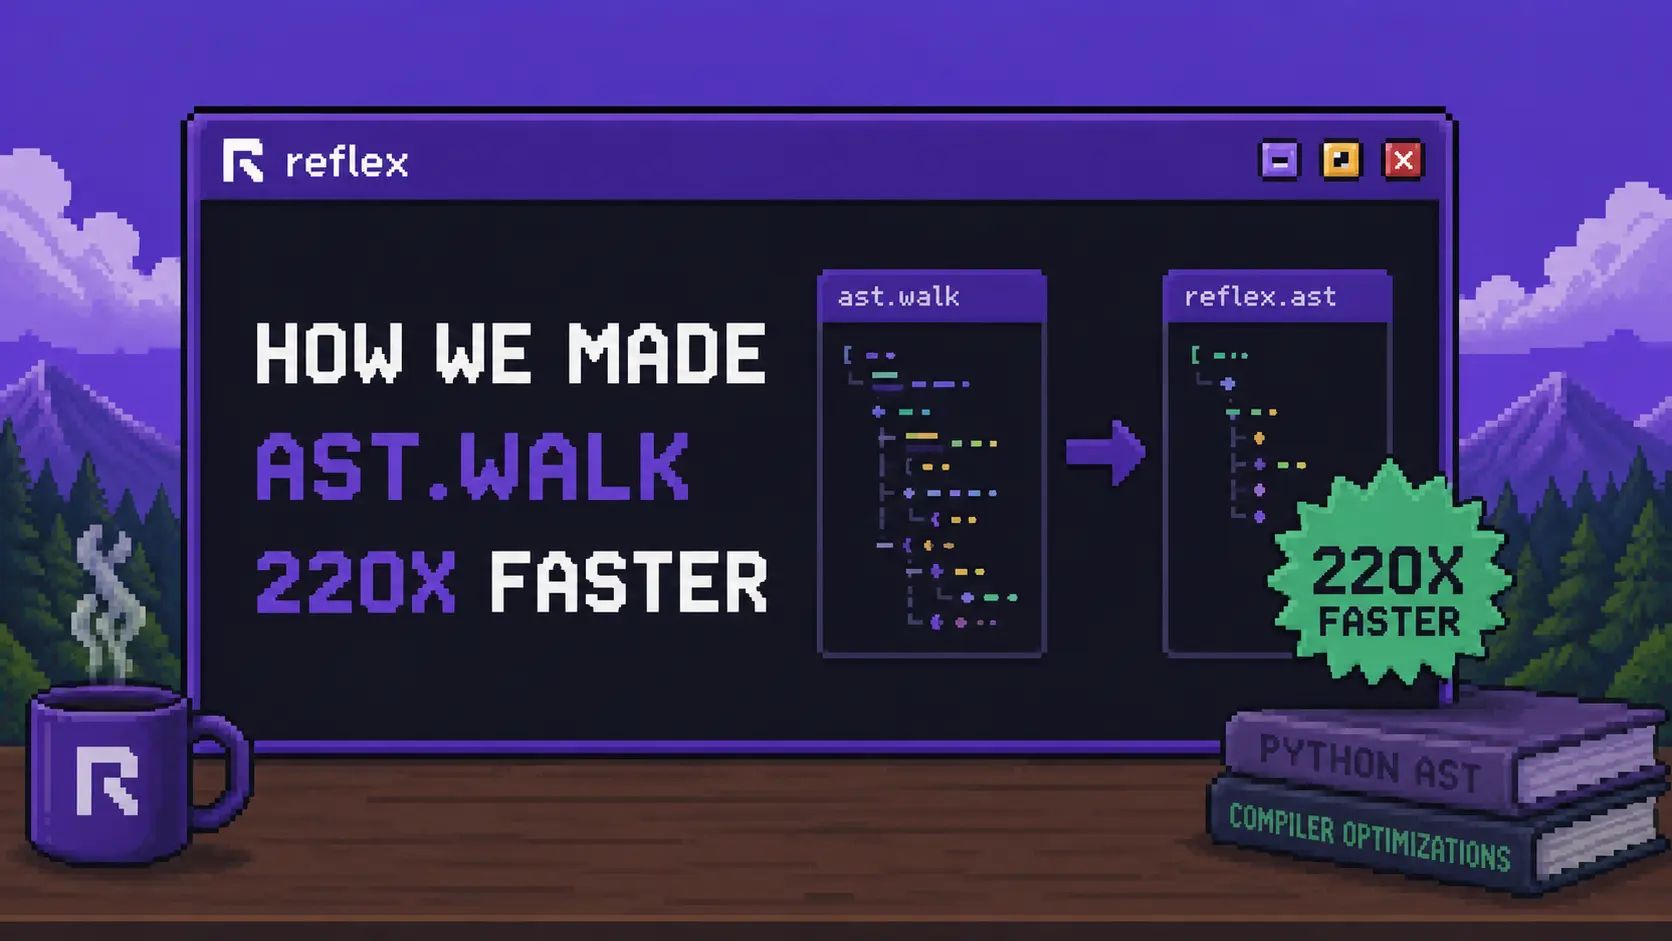
Why ast.walk when you can ast.sprint? How we made Python AST traversal 220x faster while building a custom linter for Reflex's AI code generation.
